In this blog post, learn how to set up the front and rear panels of the Maury Microwave HA7062D...
How Do You Measure the Phase Noise of an Oven-Controlled Crystal Oscillator?
Fundamental to various devices and systems, oscillators are components that produce repetitive, oscillating signals, such as sinusoidal waves.
Some oscillators generate a fixed output where the waveform’s amplitude and frequency remain constant, while others are variable with the ability to adjust the amplitude and change/tune the signal frequency as required, within the limits of the design. Although types and use-cases vary widely, a critical performance benchmark among oscillators is the quality of the output frequency.
All oscillators deviate from ideal, theoretical behavior where the output is completely pure at the intended frequency. Actual behavior will produce various levels of phase noise, which are random fluctuations in the phase or frequency of the signal. Phase noise analysis determines the severity of frequency instability, with low levels indicating a purer signal and higher quality oscillator.
This blog post reviews how to make a phase noise measurement of a 100 MHz oven-controlled crystal oscillator (OCXO) using the Holzworth HA7062D Real-Time Phase Noise Analyzer.
Phase Noise Measurement Setup
The device under test (DUT), which in this case is the OCXO, must first connect to the phase noise analyzer. After establishing a connection, users can input a supply voltage and tune voltage to the DUT if required, both of which the phase noise analyzer can provide. 
When choosing the desired measurement type, the HA7062D offers several measurement choices:
- Absolute phase noise characterizes the performance of signal sources, such as signal generators and oscillators.
- Additive phase noise characterizes the phase noise contributions of multi-port devices, such as mixers and amplifiers.
- Baseband measurements are typically used with external phase detectors or measuring DC power supplies.
- Amplitude noise measures the change in amplitude of the carrier signal.
- AM/PM measures the phase deviations due to variations in amplitude.
In this case, an absolute phase noise measurement is the appropriate choice to test the performance of an OCXO.
An absolute phase noise measurement compares the DUT to the analyzer’s internal local oscillators (LOs), which means the LOs must have lower phase noise (or better phase noise performance) than the DUT. While increasing the number of cross correlations may be able to resolve a minor difference in performance, some cases require “External LO Mode” operation. This setup uses two high-performance external sources as the LOs, which connect to the HA7062D’s front end LO1 and LO2 input ports.
Users can adjust various additional measurement settings. Two of note include:
-
- The measurement offset range to select the frequency start and stop points.
- The desired number of correlations for the analyzer to perform.
After these selections, users can measure the phase noise of an oscillator and change parameters accordingly after viewing results.

STEP 1: By navigating to the "Devices" tab in the right-hand side menu of the analyzer's control software, users can connect the DUT to the phase noise analyzer.

STEP 2: In the "Outputs" tab, users can set a supply voltage and a tune voltage, both of which can be supplied by the analyzer itself.

STEP 3: Under the "Measurement" tab, users can choose the desired type of measurement, number of correlations, and measurement offset range.

STEP 4: Click "Acquire" to make a phase noise measurement of the OCXO.
Cross Correlations
A phase noise analyzer’s internal reference LOs generate phase noise. Cross correlation is a way to remove the test instrument’s phase noise from obscuring what we actually want to measure – the phase noise of the DUT.
During a cross-correlated phase noise measurement, the DUT output is fed into the analyzer and split down two separate measurement paths, each with their own LO. Each path has the same amount of DUT phase noise since the signal was split at the start of the measurement. Since the analyzer’s LOs are driven by their own reference circuit, they contribute uncorrelated or different levels of phase noise on each path.
Cross correlation is a process that removes the differences between the two channels (the LO phase noise) to uncover the DUT phase noise. Increasing the number of cross correlations further reduces the level of instrument noise and improves results, but can affect the speed of the measurement.
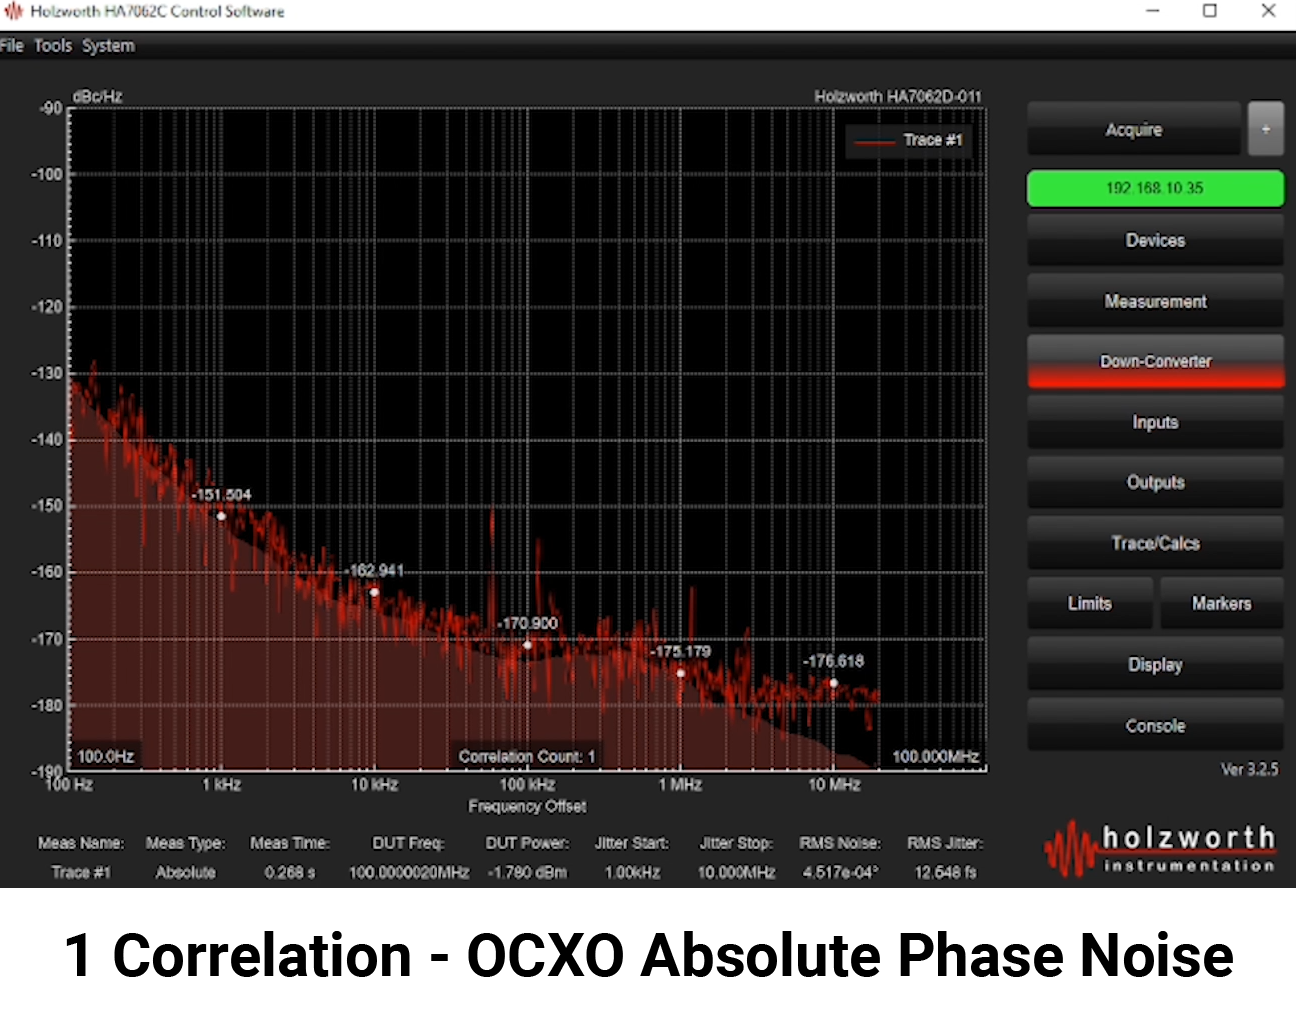
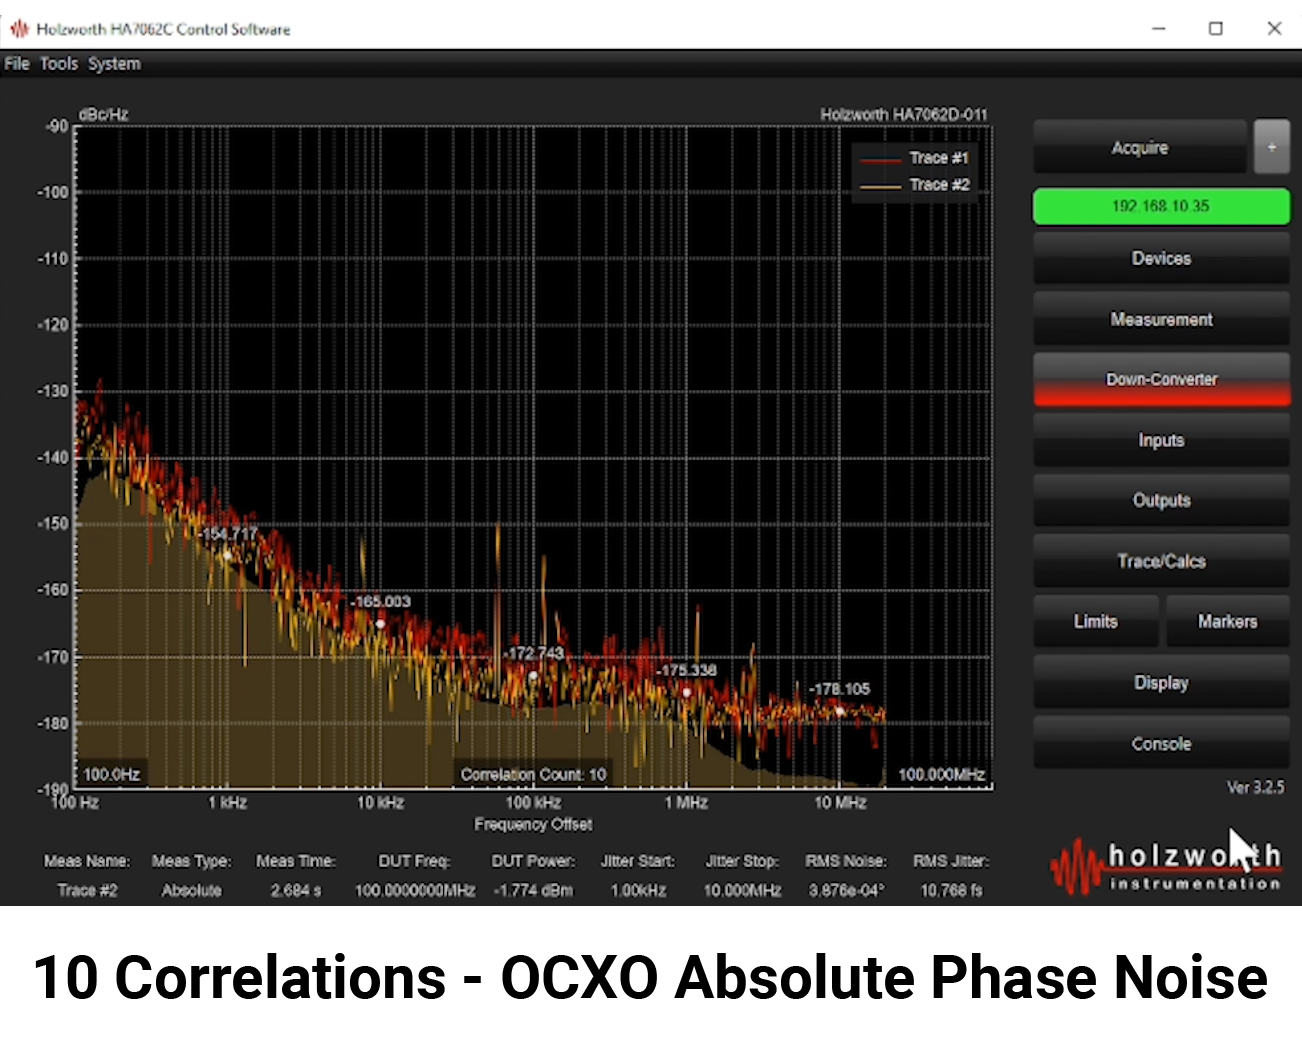
A phase noise measurement of the OCXO using 1 cross correlation (left graph) leaves a small margin between the approximated noise floor, which is the bottom shaded region, and the measurement. In this case, a greater number of correlations will reduce the measurement uncertainty. A phase noise measurement with 10 correlations (right graph) reduces the noise floor and creates greater separation from the data trace.


Although increasing the number of cross correlations affects measurement speed, the HA7062D still provides a quick evaluation of oscillator performance for both 1 and 10 correlations.
Watch Now: Measuring OCXO Phase Noise
How can users remove spurs and noise from the measurement trace? How can users define and apply their own measurement markers? Can users scale dBc/Hz values to true dBc? What export options are available?
The answers are available in the video, “How to Measure the Phase Noise of an Oscillator with a Holzworth Phase Noise Analyzer.” Watch the demonstration for a complete step-by-step navigation through the HA7062D GUI during the absolute phase noise measurement of an OCXO.


.png?height=200&name=Asset%202%20(2).png)